- Debugging
- Debugging a Dynamics 365 CRM plugin
- Trace Logs
- Persist to Entity (Recommended)
- Exception
- Summary
Debugging
Debugging is the process of identifying and resolving errors in a system. Though it is a complex and time-consuming task, it is necessary to debug the code and ensure the functionality of the application. Because, a single bug can cause a drastic impact. It might be an iterative process and might require multiple attempts to track and resolve the bugs.
Debugging a Dynamics 365 CRM plugin
Dynamics 365 CRM plugins are developed in C#(.NET). Plugins are of two types, which are synchronous and asynchronous. We cannot debug the plugin on the runtime, rather we can do it using profiler. A profiler will capture the instance of the plugin execution and save it as a row in the plugin-profiler table in Dataverse. You need Plugin Registration tool to debug the Dataverse plugins.
There are multiple ways in debugging a Dynamics 365 CRM Plugins. They are.
- Trace Logs
- Persist to Entity
- Exception
Trace Logs
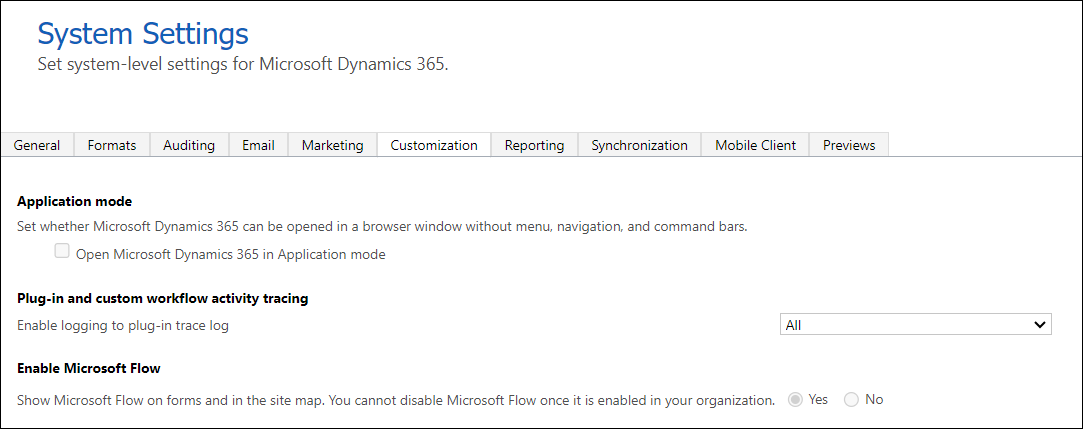
We can log the errors using ITracingService interface in plugin. This trace log accepts only the string to log. It is used for debugging both synchronous and asynchronous plugins. If you want to log values of any other data type, you should typecast it to string. This will log the errors, and it will appear on the Plugin Trace logs. Before that, you should make sure that your environment enabled the Plugin Trace logs.
ITracingService log = (ITracingService)serviceProvider.GetService(typeof(ITracingService));log.Trace("Execution Started");
- To do so, you should navigate to Settings 🡲 Advanced Settings 🡲 Administration 🡲 System Settings 🡲 Customization 🡲 Enable Plug-in and custom workflow activity tracing to All (if not enabled).
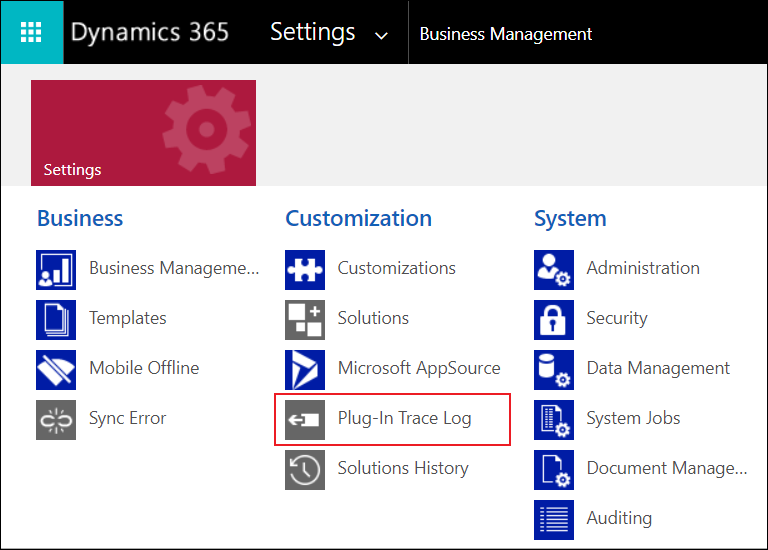
- To see the Trace logs, navigate to Settings 🡲 Advanced Settings 🡲 Plug-In Trace log.
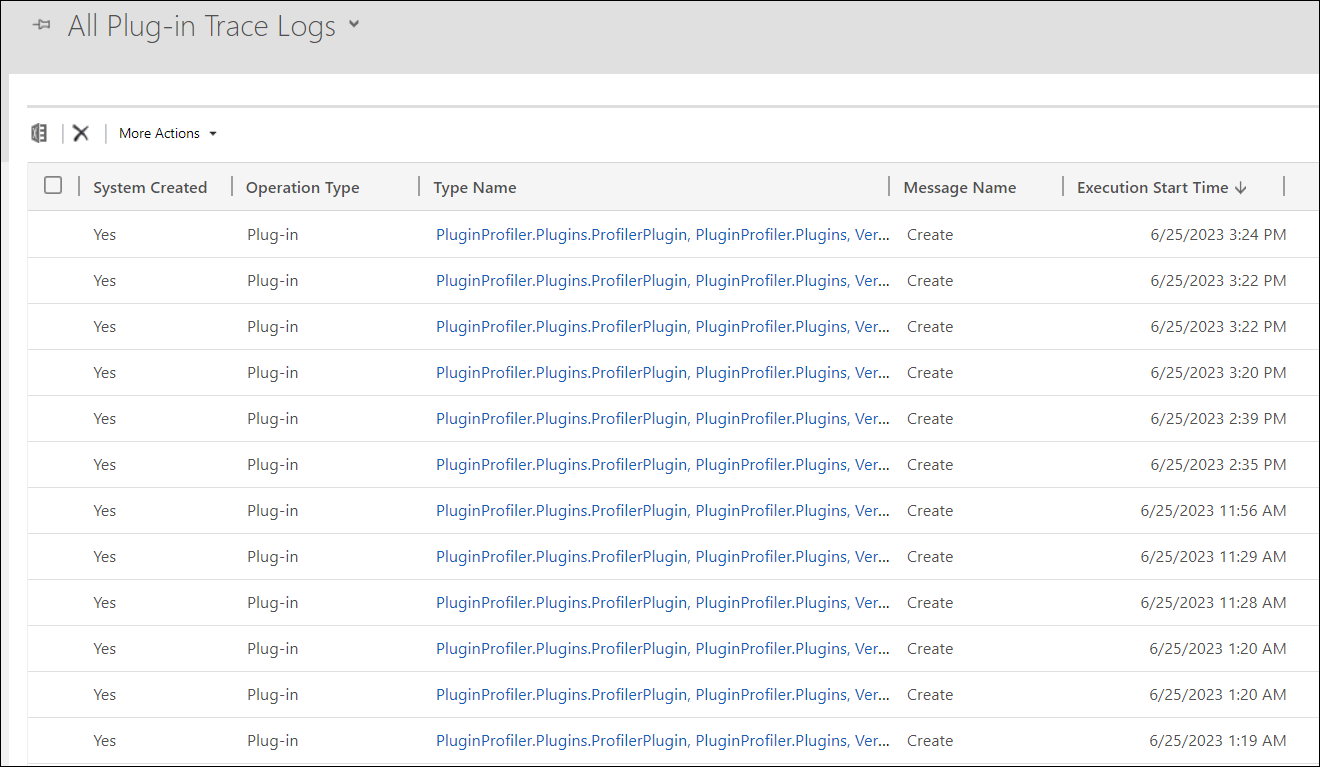
- Once we hit the Plug-In Trace log, it will take us to the Plugin Trace Logs grid view page. Click on any of the record, you will get to see the trace logs which are logged during the execution of Plugin code.
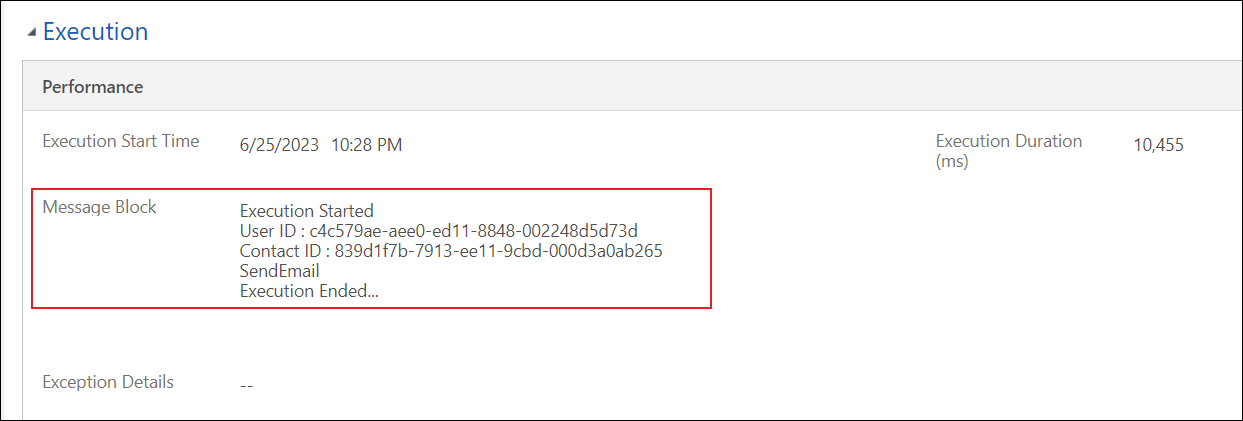
- Open any of the record, you will see the configuration and execution details. In the execution section, you will see the message block which we logged while developing a plugin.
Persist to Entity (Recommended)
Follow the below steps to debug plugin using Persist to Entity:
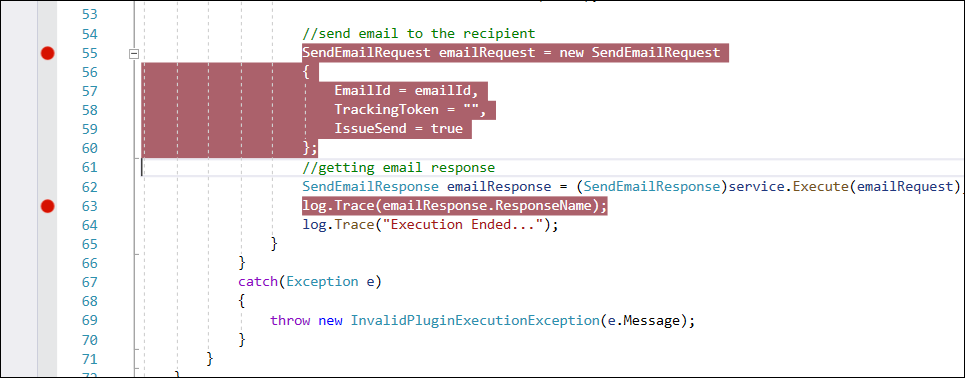
- In Visual Studio, place some break points in the code to catch the debugger.
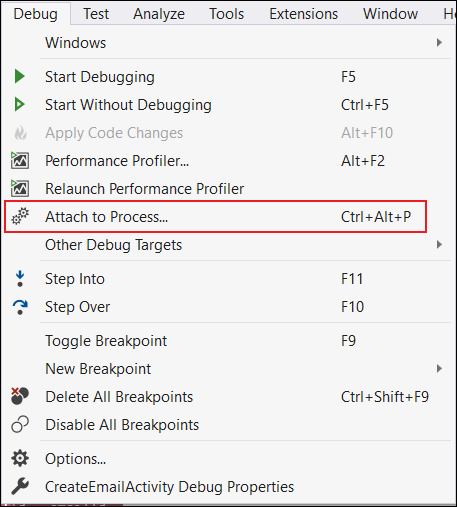
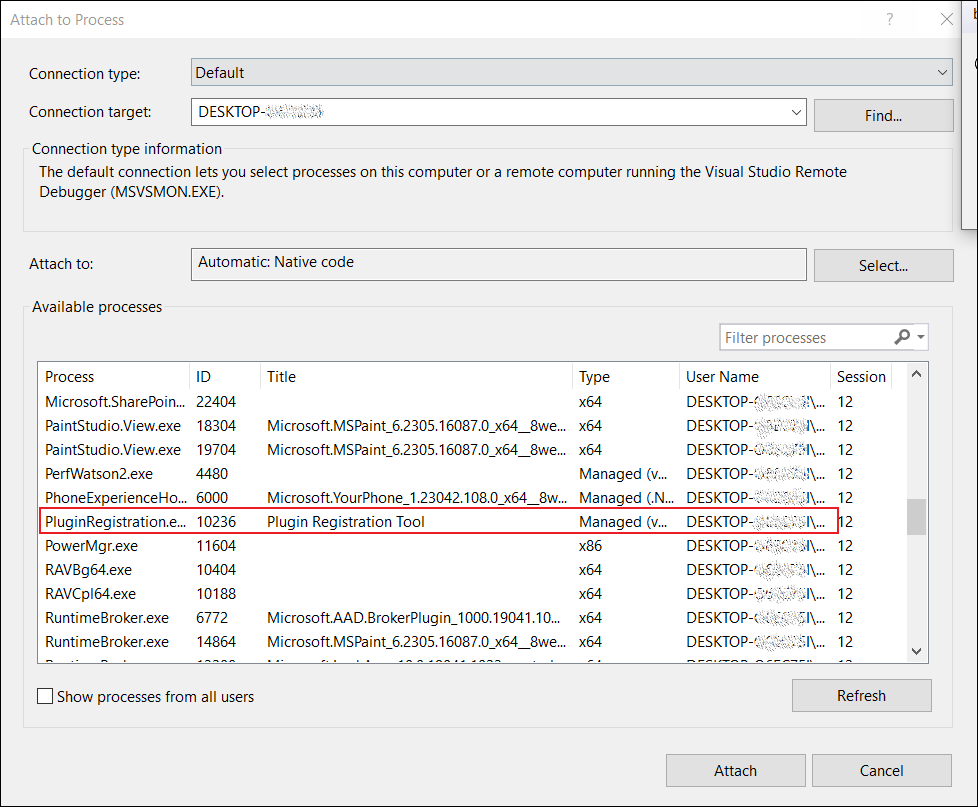
- Go to Debug 🡲 Attach to Process and select Plugin Registration Tool and hit Attach.
- For that, we have to register our plugin in Plugin Registration Tool. Create a new plugin assembly by uploading the .dll file from files.
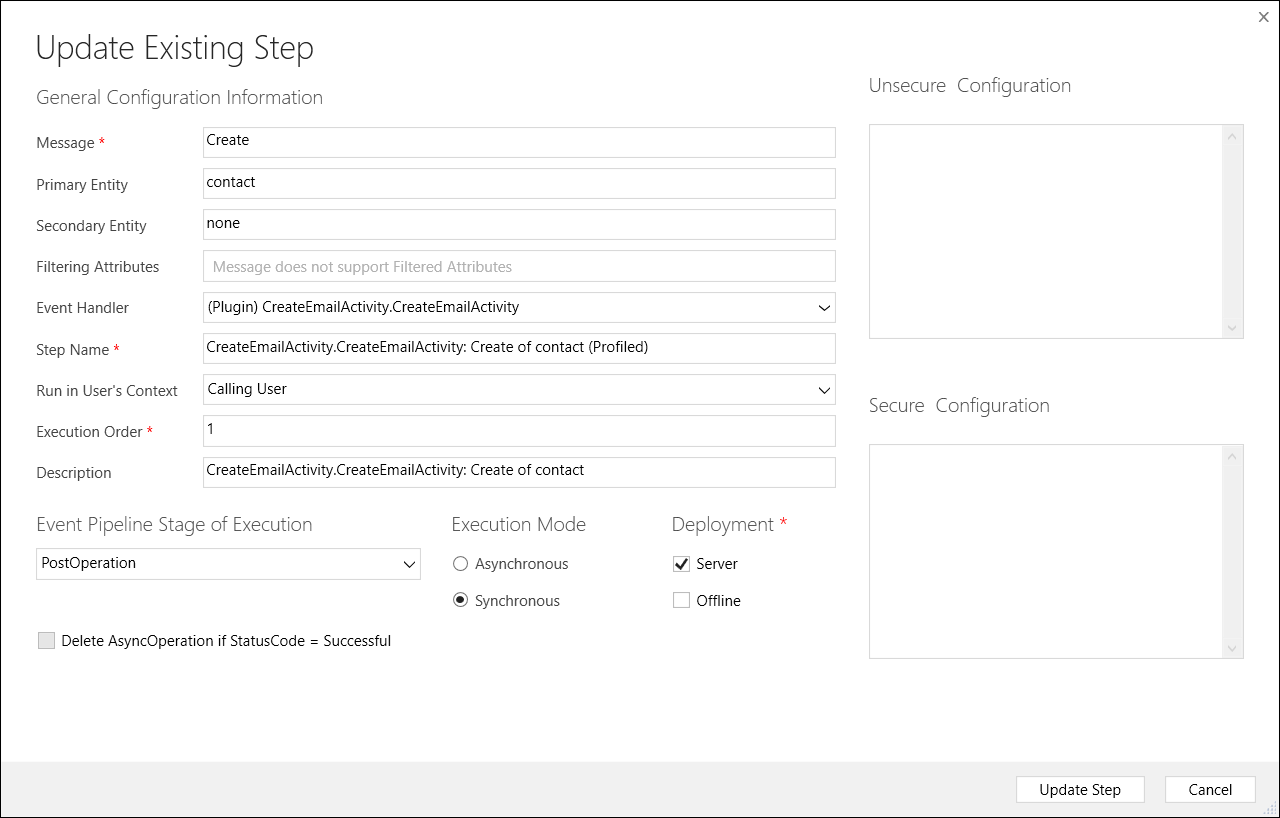
- Create a new step under the plugin by adding message, entity, event-execution, and type.
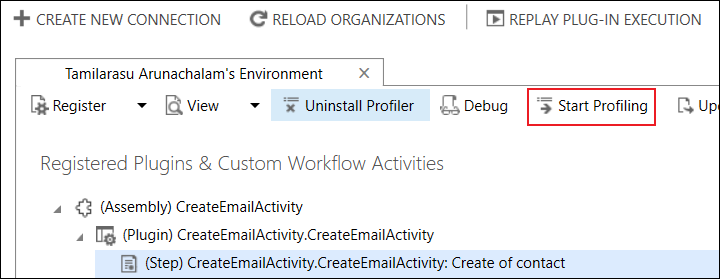
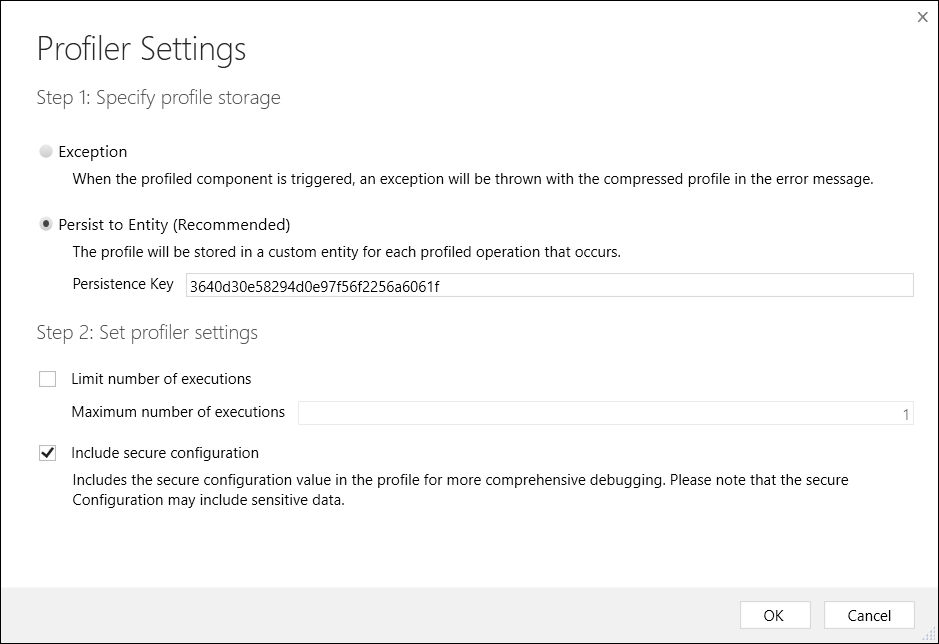
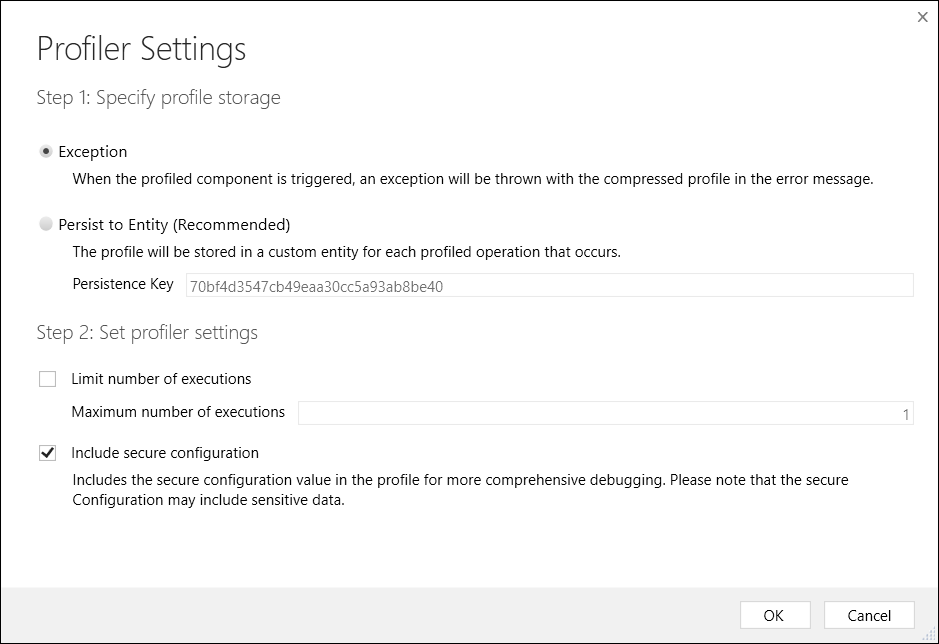
- Select the step and click on the Start Profiling button on the navigation bar. A dialog box prompts up and asking for specifying profiler storage option.
- Select persist to Entity as a profile storage option and click on the OK.
- Once the plugin got profiled, you will see the text profiled near your plugin step.
- Then perform the actual scenario to capture the profile. In my context, I have created a new contact record.
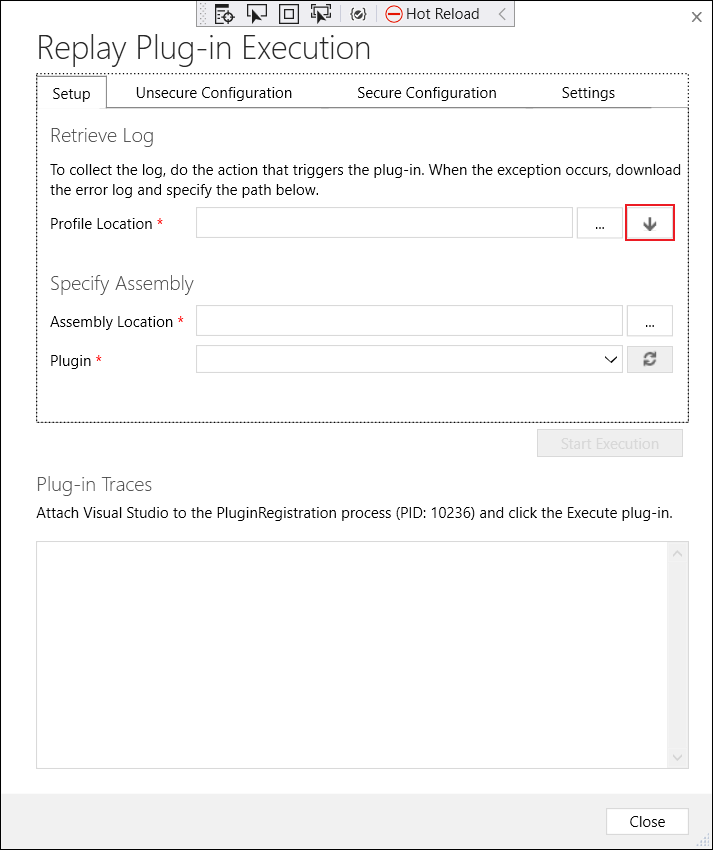
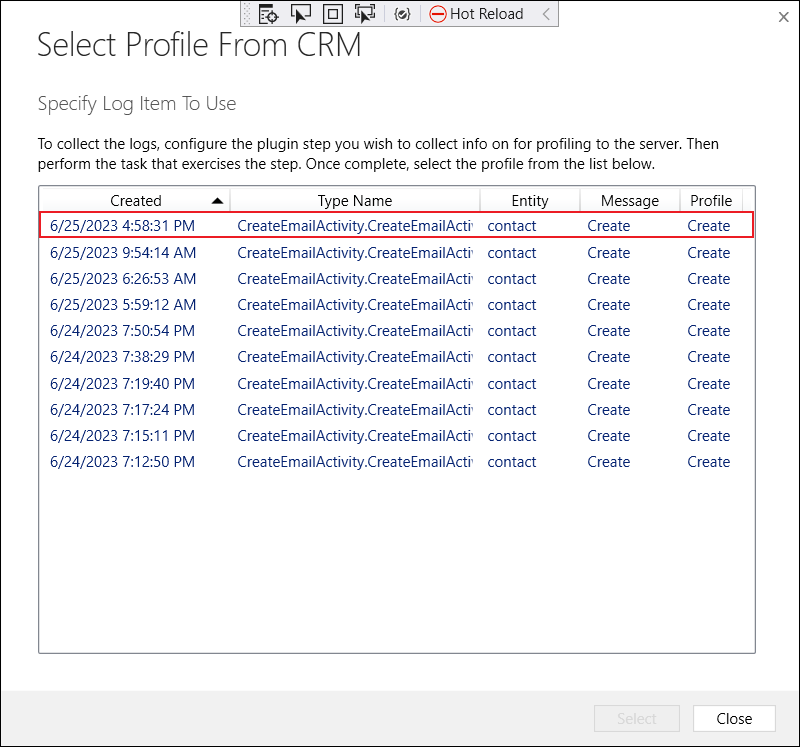
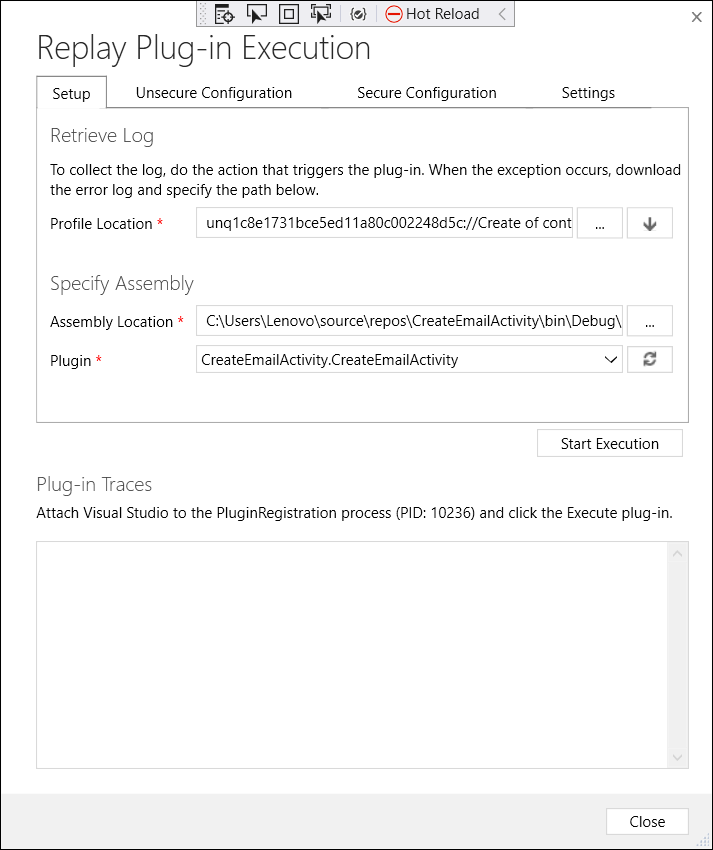
- Click on debug in Plugin Registration Tool and click on the down arrow symbol to add the captured Profile
- Add the assembly and click on start execution button
- Once you click Start Execution, it will navigate to the Visual Studio and stops at the break point. Then you can move forward by clicking F10 key. To check the values for the variables, you can hover over the variable and make sure the value is correct or change the code to make it right.
Exception
Follow the below steps to debug plugin using Exception:
- Place the break points on the code in Visual Studio and Go to Debug 🡲 Attach to Process and Select Plugin Registration Tool.
- In Plugin Registration tool, select the step and click on Start Profiling.
- Select Exception for profile storage and click OK.
- Go to the Application and perform the action to trigger the plugin.
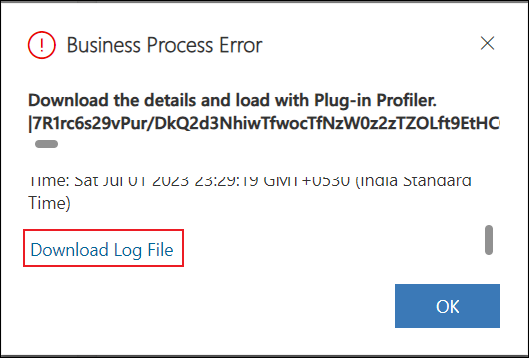
- In my context, I have to create a contact to trigger the plugin. I will get the business process error with the exception file in it.
- Click on the download log file and you will get the .txt file.
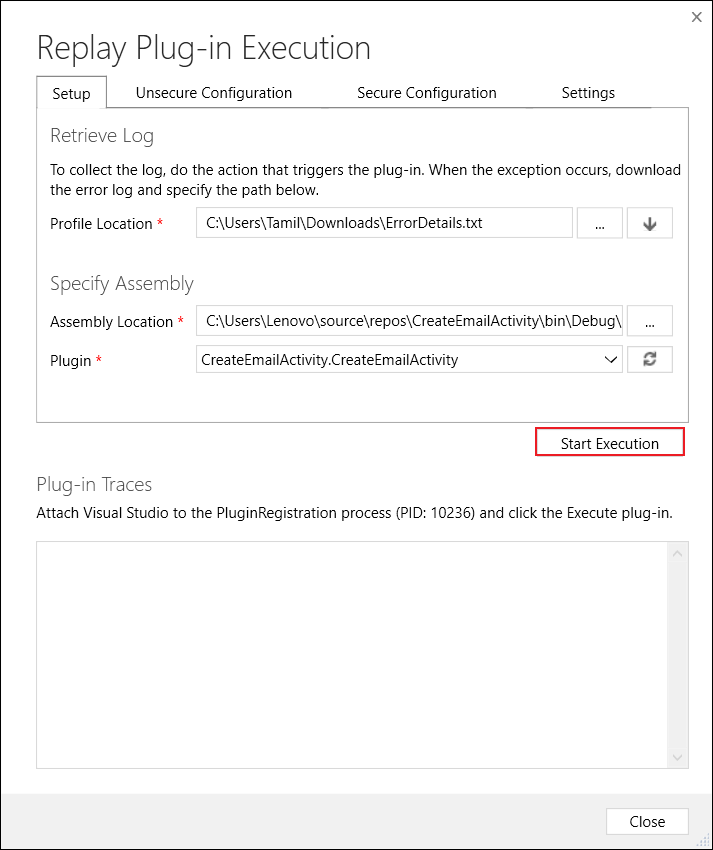
- Go to the Plugin Registration Tool and click on Debug and select the downloaded .txt file and add the respective assembly.
- Click on the Start Execution, it will navigate to Visual Studio and hit the break point.
- You can move the debugger using F10 key and hover over the variables to check the values.

